【Python】pyecharts 模块 ⑥ ( 绘制柱状图 | pyecharts 绘制柱状图步骤 | 柱状图 x 轴 / y 轴 翻转 | 柱状图数据标签位置设置 )
文章目录
pyecharts 画廊网站 : https://gallery.pyecharts.org/#/
- 在该网站可查看官方示例
一、pyecharts 绘制基础柱状图
1、pyecharts 绘制柱状图步骤
首先 , 导入 柱状图 Bar 类 , 该类定义在 pyecharts.charts 模块中 ;
# 导入 pyecharts 模块中的 柱状图 Bar 类
from pyecharts.charts import Bar
然后 , 创建 柱状图 Bar 类型 实例对象 , 该对象代表了一个柱状图 ;
# 创建柱状图对象
bar = Bar()
再后 , 设置该 柱状图的 x 轴 和 y 轴数据 ,
- 调用 Bar#add_xaxis() 函数 , 设置 x 轴数据 , 实际数据放在 列表 中 , 作为参数传递给该函数 ;
- 调用 Bar#add_yaxis() 函数 , 设置 y 轴数据 , 第一个参数是柱状图标题 , 第二个参数 是 列表类型的容器变量 , 表示 y 轴的数据 ;
# 设置 x 轴数据
bar.add_xaxis(["河北", "河南", "山东", "山西"])

# 设置 y 轴数据
bar.add_yaxis("GDP", [40391, 58887, 82875, 22870])
最后 , 调用 Bar#render() 函数 , 生成最终的柱状图 ;
# 生成柱状图
bar.render()
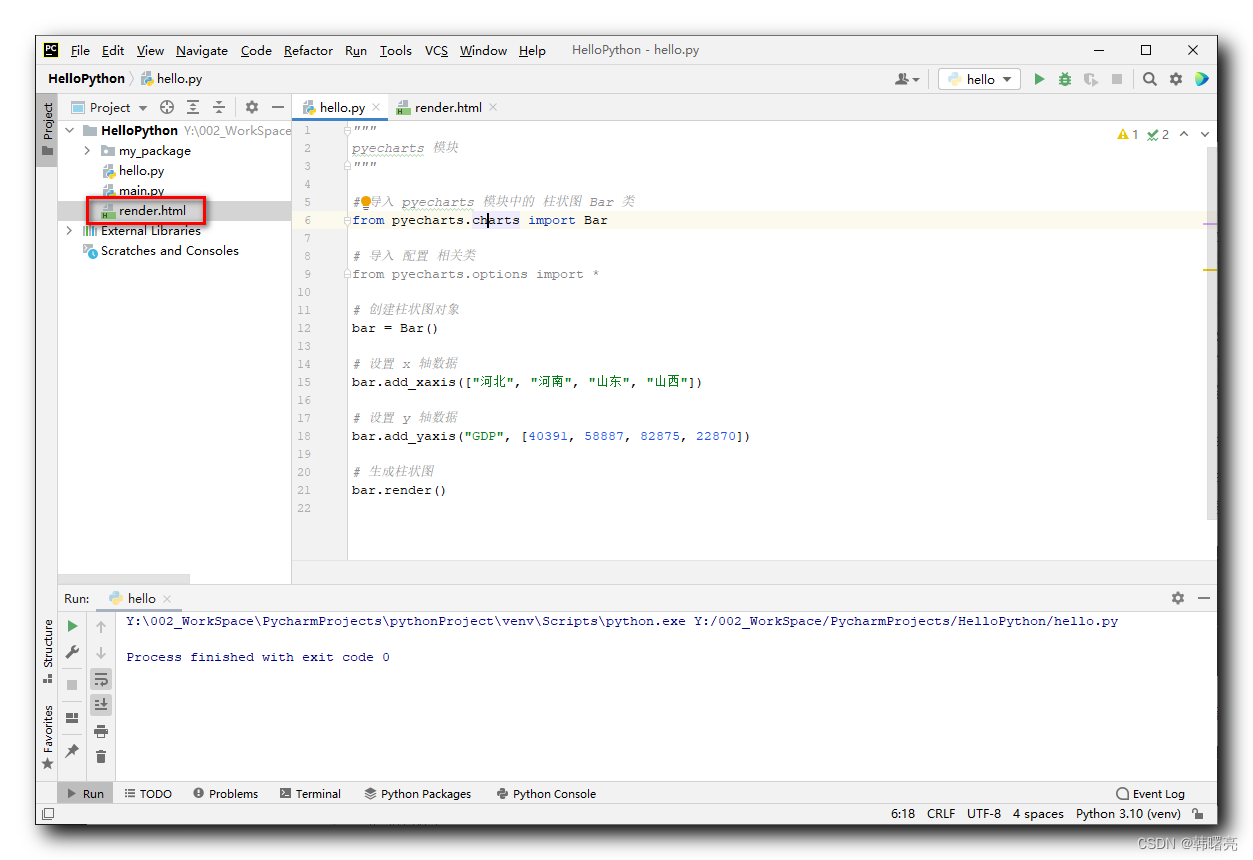
在 该 源码 的 同级目录下 , 生成的 render.html 就是生成的 柱状图 ;
2、代码示例 - pyecharts 绘制柱状图
代码示例 :
"""
pyecharts 模块
"""

# 导入 pyecharts 模块中的 柱状图 Bar 类
from pyecharts.charts import Bar

# 导入 配置 相关类
from pyecharts.options import *

# 创建柱状图对象
bar = Bar()

# 设置 x 轴数据
bar.add_xaxis(["河北", "河南", "山东", "山西"])

# 设置 y 轴数据
bar.add_yaxis("GDP", [40391, 58887, 82875, 22870])

# 生成柱状图
bar.render()
执行结果 :

生成的 render.html 如下 ( 仅做参考 - 没事别点开 ) :
<!DOCTYPE html>
<html>
<head>
    <meta charset="UTF-8">
    <title>Awesome-pyecharts</title>
                <script type="text/javascript" src="https://assets.pyecharts.org/assets/v5/echarts.min.js"></script>

</head>
<body >
    <div id="cefd15ca8045443380ca43cf4b559bc1" class="chart-container" style="width:900px; height:500px; "></div>
    <script>
        var chart_cefd15ca8045443380ca43cf4b559bc1 = echarts.init(
            document.getElementById('cefd15ca8045443380ca43cf4b559bc1'), 'white', {renderer: 'canvas'});
        var option_cefd15ca8045443380ca43cf4b559bc1 = {
    "animation": true,
    "animationThreshold": 2000,
    "animationDuration": 1000,
    "animationEasing": "cubicOut",
    "animationDelay": 0,
    "animationDurationUpdate": 300,
    "animationEasingUpdate": "cubicOut",
    "animationDelayUpdate": 0,
    "aria": {
        "enabled": false
    },
    "color": [
        "#5470c6",
        "#91cc75",
        "#fac858",
        "#ee6666",
        "#73c0de",
        "#3ba272",
        "#fc8452",
        "#9a60b4",
        "#ea7ccc"
    ],
    "series": [
        {
            "type": "bar",
            "name": "GDP",
            "legendHoverLink": true,
            "data": [
                40391,
                58887,
                82875,
                22870
            ],
            "realtimeSort": false,
            "showBackground": false,
            "stackStrategy": "samesign",
            "cursor": "pointer",
            "barMinHeight": 0,
            "barCategoryGap": "20%",
            "barGap": "30%",
            "large": false,
            "largeThreshold": 400,
            "seriesLayoutBy": "column",
            "datasetIndex": 0,
            "clip": true,
            "zlevel": 0,
            "z": 2,
            "label": {
                "show": true,
                "margin": 8
            }
        }
    ],
    "legend": [
        {
            "data": [
                "GDP"
            ],
            "selected": {}
        }
    ],
    "tooltip": {
        "show": true,
        "trigger": "item",
        "triggerOn": "mousemove|click",
        "axisPointer": {
            "type": "line"
        },
        "showContent": true,
        "alwaysShowContent": false,
        "showDelay": 0,
        "hideDelay": 100,
        "enterable": false,
        "confine": false,
        "appendToBody": false,
        "transitionDuration": 0.4,
        "textStyle": {
            "fontSize": 14
        },
        "borderWidth": 0,
        "padding": 5,
        "order": "seriesAsc"
    },
    "xAxis": [
        {
            "show": true,
            "scale": false,
            "nameLocation": "end",
            "nameGap": 15,
            "gridIndex": 0,
            "inverse": false,
            "offset": 0,
            "splitNumber": 5,
            "minInterval": 0,
            "splitLine": {
                "show": true,
                "lineStyle": {
                    "show": true,
                    "width": 1,
                    "opacity": 1,
                    "curveness": 0,
                    "type": "solid"
                }
            },
            "data": [
                "u6cb3u5317",
                "u6cb3u5357",
                "u5c71u4e1c",
                "u5c71u897f"
            ]
        }
    ],
    "yAxis": [
        {
            "show": true,
            "scale": false,
            "nameLocation": "end",
            "nameGap": 15,
            "gridIndex": 0,
            "inverse": false,
            "offset": 0,
            "splitNumber": 5,
            "minInterval": 0,
            "splitLine": {
                "show": true,
                "lineStyle": {
                    "show": true,
                    "width": 1,
                    "opacity": 1,
                    "curveness": 0,
                    "type": "solid"
                }
            }
        }
    ]
};
        chart_cefd15ca8045443380ca43cf4b559bc1.setOption(option_cefd15ca8045443380ca43cf4b559bc1);
    </script>
</body>
</html>
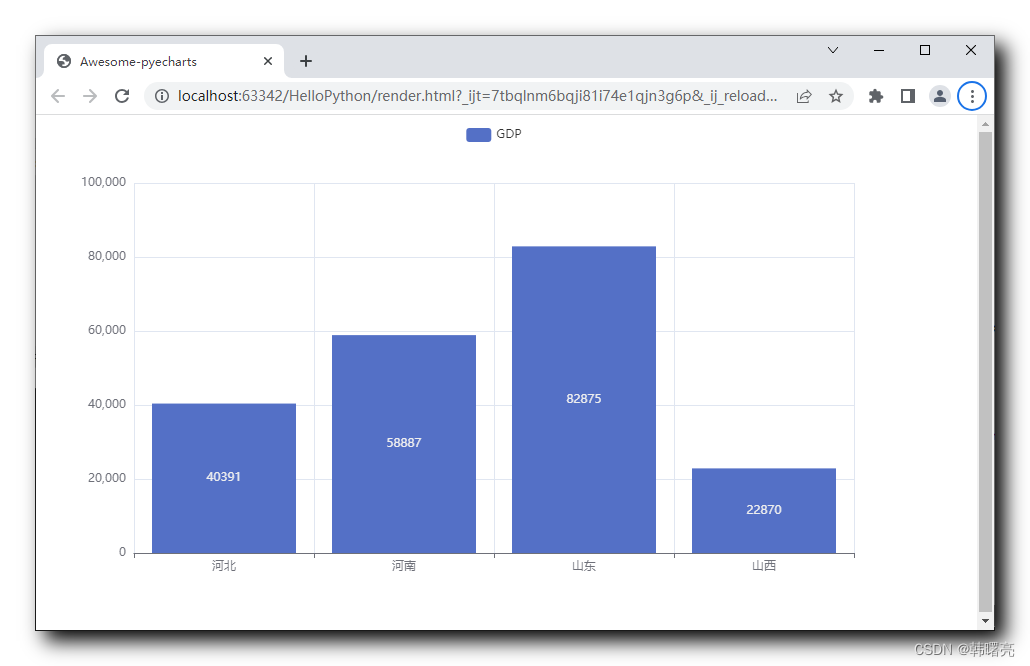
柱状图效果如下 :
二、柱状图其它设置
1、柱状图 x 轴 / y 轴 翻转
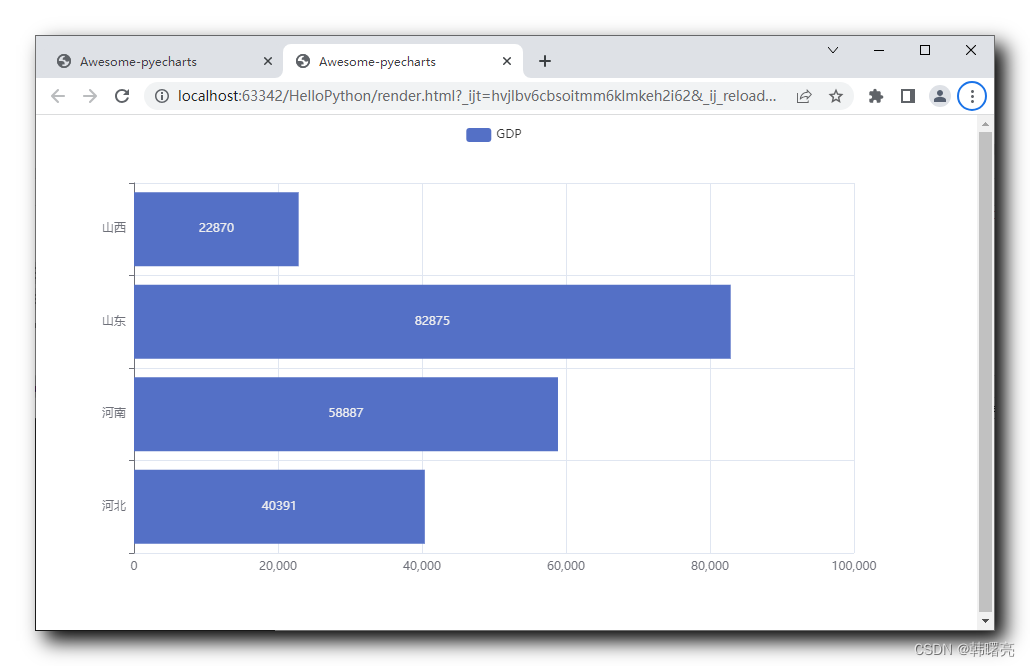
调用 Bar#reversal_axis() 函数 , 可以翻转 柱状图 的 x 轴 和 y 轴 ;
代码示例 :
"""
pyecharts 模块
"""

# 导入 pyecharts 模块中的 柱状图 Bar 类
from pyecharts.charts import Bar

# 导入 配置 相关类
from pyecharts.options import *

# 创建柱状图对象
bar = Bar()

# 设置 x 轴数据
bar.add_xaxis(["河北", "河南", "山东", "山西"])

# 设置 y 轴数据
bar.add_yaxis("GDP", [40391, 58887, 82875, 22870])

# 翻转 x 轴 / y 轴
bar.reversal_axis()

# 生成柱状图
bar.render()
打开运行后生成的 render.html 网页 , 效果如下 :
2、柱状图数据标签位置设置
上面的柱状图的 数值标签 都在柱子 的中心位置显示 , 这是默认显示位置 ;
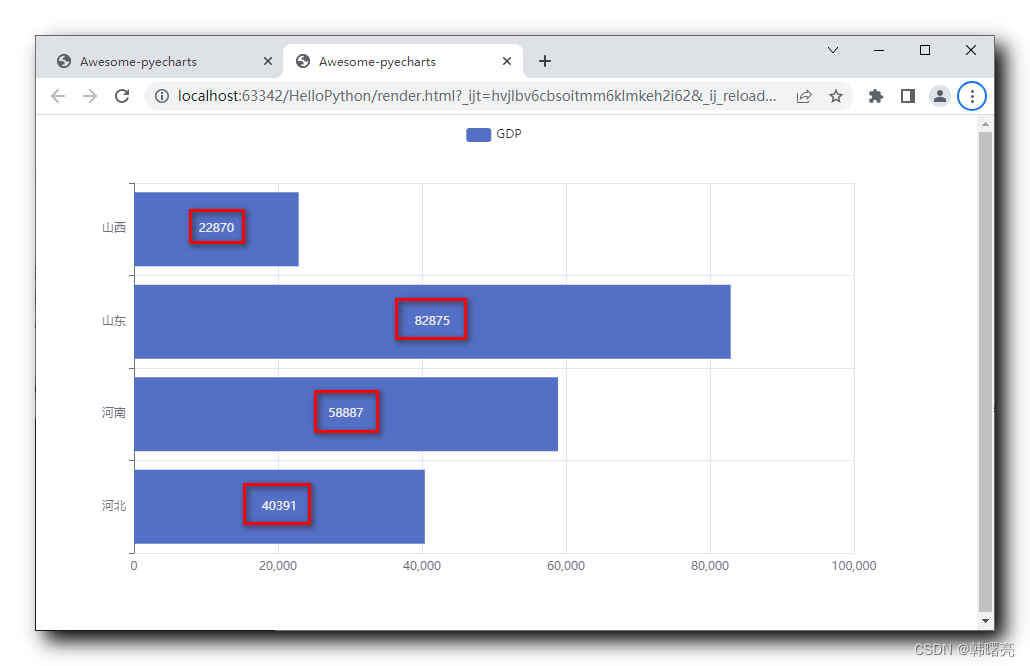
如果我们想要让 数值数据 显示在最右侧 , 在添加 y 轴数据时 , 为其设置一个 LabelOpts 参数 ;
# 设置 y 轴数据
bar.add_yaxis("GDP", [40391, 58887, 82875, 22870],
              label_opts=LabelOpts(position="right"))
完整代码示例 :
"""
pyecharts 模块
"""

# 导入 pyecharts 模块中的 柱状图 Bar 类
from pyecharts.charts import Bar

# 导入 配置 相关类
from pyecharts.options import *

# 创建柱状图对象
bar = Bar()

# 设置 x 轴数据
bar.add_xaxis(["河北", "河南", "山东", "山西"])

# 设置 y 轴数据
bar.add_yaxis("GDP", [40391, 58887, 82875, 22870],
              label_opts=LabelOpts(position="right"))

# 翻转 x 轴 / y 轴
bar.reversal_axis()

# 生成柱状图
bar.render()
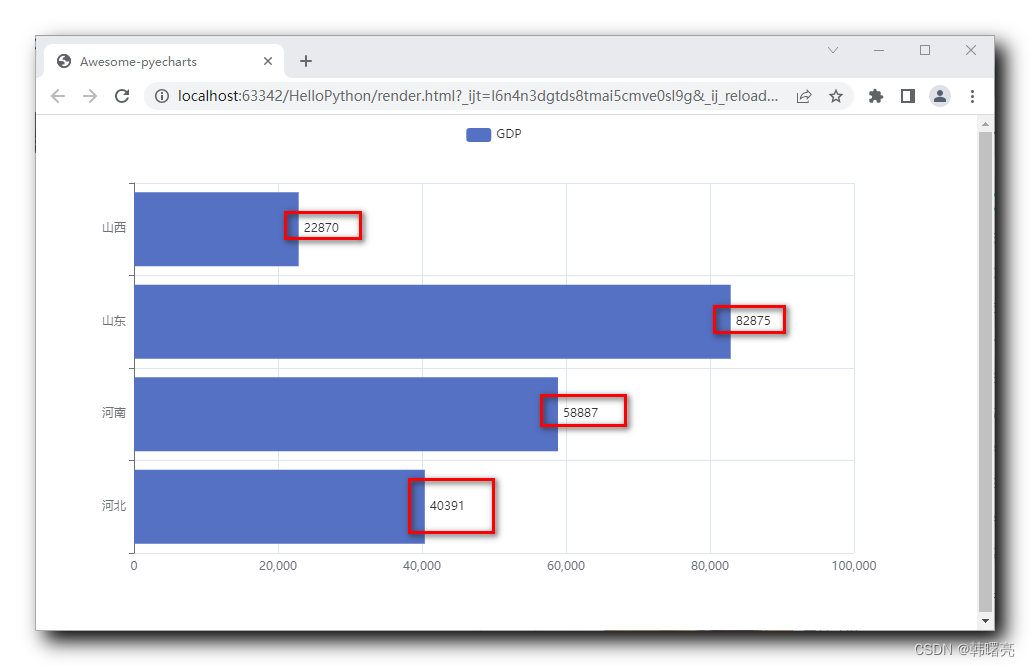
render.html 网页显示效果 : 数值都在柱状数据的右侧显示 ;
