使用 AntV X6 + vue 实现单线流程图
使用 AntV X6 + vue 实现单线流程图
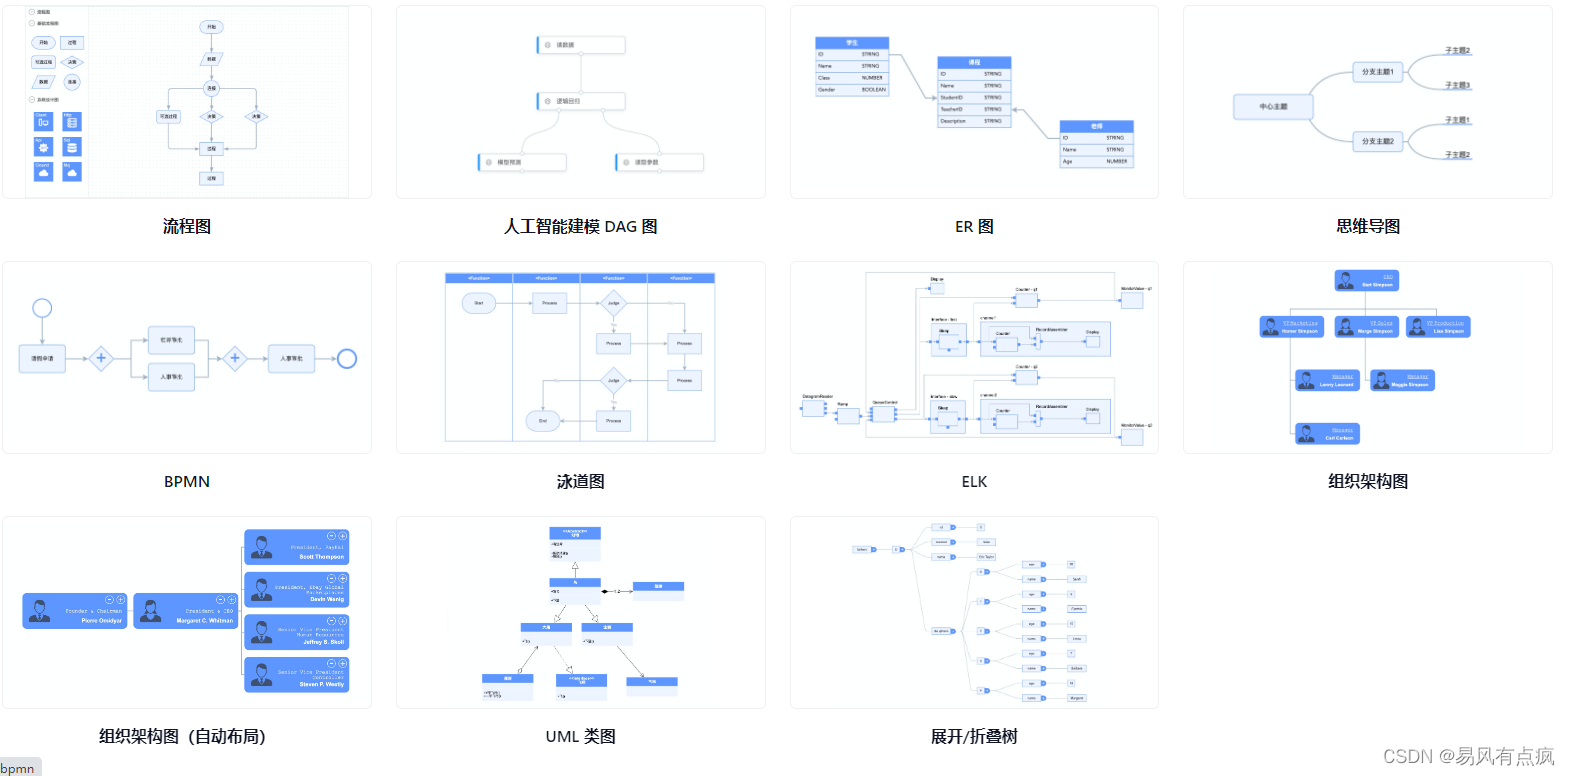
X6 是 AntV 旗下的图编辑引擎,提供了一系列开箱即用的交互组件和简单易用的节点定制能力,方便我们快速搭建 DAG 图、ER 图、流程图等应用。

安装
yarn add @antv/x6@1.34.6
Tips: 目前 X6 有 1.x 和 2.x 两个版本,因为官方文档的示例代码都是 1.x 版本的,所以本文档也是基于 1.x 版本的,如果你使用的是 2.x 版本,可以参考官方文档。
常用 API
| API | 说明 | 使用方法 |
|---|---|---|
| Graph | 图实例 | const graph=new Graph() |
| graph.zoomTo | 缩放图形 | graph.zoomTo(0.8) |
| graph.centerContent | 图形居中 | graph.centerContent() |
| graph.getCell | 获取节点 | graph.getCell(node.id) |
| graph.addCell | 新增节点 | graph.addCell([node1,edge1,node2,node3]) |
| graph.removeCells | 删除节点 | graph.removeCells(cell) |
| graph.createEdge | 创建连接线 | graph.createEdge(node1,node2) |
| graph.removeEdge | 删除连接线 | graph.removeEdge(edge.id) |
| graph.getNodes | 获取所有节点 | graph.getNodes() |
| graph.getEdges | 获取所有连接线 | graph.getEdges() |
| Graph.registerNod | 自定义元素样式 | 可查看文档 |
demo 代码(以下为 vue 实现单线流程图示例)
实现效果

vue 代码
Tips: 示例代码需安装 dagre 和 insert-css 依赖
<template>
  <div id="container"></div>
</template>
<script setup lang="ts">
  import { Graph, Cell, Node, Color, Dom } from '@antv/x6'
  import dagre from 'dagre'
  import insertCss from 'insert-css'
  import { ref, reactive, computed, watch, onMounted, onUnmounted } from 'vue'

  const male =
    'https://gw.alipayobjects.com/mdn/rms_43231b/afts/img/A*kUy8SrEDp6YAAAAAAAAAAAAAARQnAQ'
  const female =
    'https://gw.alipayobjects.com/mdn/rms_43231b/afts/img/A*f6hhT75YjkIAAAAAAAAAAAAAARQnAQ'

  let graph, nodes, edges

  // 自定义节点,使用的是 svg格式
  Graph.registerNode(
    'org-node',
    {
      width: 260,
      height: 88,
      markup: [
        {
          tagName: 'rect',
          attrs: {
            class: 'card',
          },
        },
        {
          tagName: 'image',
          attrs: {
            class: 'image',
          },
        },
        {
          tagName: 'text',
          attrs: {
            class: 'rank',
          },
        },
        {
          tagName: 'text',
          attrs: {
            class: 'name',
          },
        },
        {
          tagName: 'g',
          attrs: {
            class: 'btn add',
          },
          children: [
            {
              tagName: 'circle',
              attrs: {
                class: 'add',
              },
            },
            {
              tagName: 'text',
              attrs: {
                class: 'add',
              },
            },
          ],
        },
        {
          tagName: 'g',
          attrs: {
            class: 'btn del',
          },
          children: [
            {
              tagName: 'circle',
              attrs: {
                class: 'del',
              },
            },
            {
              tagName: 'text',
              attrs: {
                class: 'del',
              },
            },
          ],
        },
      ],
      attrs: {
        '.card': {
          rx: 10,
          ry: 10,
          refWidth: '100%',
          refHeight: '100%',
          fill: '#5F95FF',
          stroke: '#5F95FF',
          strokeWidth: 1,
          pointerEvents: 'visiblePainted',
        },
        '.image': {
          x: 16,
          y: 16,
          width: 56,
          height: 56,
          opacity: 0.7,
        },
        '.rank': {
          refX: 0.95,
          refY: 0.5,
          fill: 'blue',
          fontFamily: 'Courier New',
          fontSize: 13,
          textAnchor: 'end',
          textVerticalAnchor: 'middle',
        },
        '.name': {
          refX: 0.95,
          refY: 0.7,
          fill: '#fff',
          fontFamily: 'Arial',
          fontSize: 14,
          fontWeight: '600',
          textAnchor: 'end',
        },
        '.btn.add': {
          refDx: -16,
          refY: 16,
          event: 'node:add',
        },
        '.btn.del': {
          refDx: -44,
          refY: 16,
          event: 'node:delete',
        },
        '.btn > circle': {
          r: 10,
          fill: 'transparent',
          stroke: '#fff',
          strokeWidth: 1,
        },
        '.btn.add > text': {
          fontSize: 20,
          fontWeight: 800,
          fill: '#fff',
          x: -5.5,
          y: 7,
          fontFamily: 'Times New Roman',
          text: '+',
        },
        '.btn.del > text': {
          fontSize: 28,
          fontWeight: 500,
          fill: '#fff',
          x: -4.5,
          y: 6,
          fontFamily: 'Times New Roman',
          text: '-',
        },
      },
    },
    true,
  )

  // 自定义边
  Graph.registerEdge(
    'org-edge',
    {
      zIndex: -1,
      attrs: {
        line: {
          strokeWidth: 2,
          stroke: '#A2B1C3',
          sourceMarker: null,
          targetMarker: null,
        },
      },
    },
    true,
  )

  let i = 1

  // 监听自定义事件
  function setup() {
    graph.on('node:add', ({ e, node }) => {
      e.stopPropagation()
      const member = createNode('新建字段' + i, '新建字段' + i, Math.random() < 0.5 ? male : female)
      i++
      graph.freeze()
      const { preEdge, nextEdge, preNode, nextNode } = getPreAndNextNodeEdge(node.id)

      if (nextEdge) {
        graph.removeEdge(nextEdge.id)
        graph.addCell([createEdge(member, nextNode)])
      }

      graph.addCell([member, createEdge(node, member)])

      layout()
    })

    graph.on('node:delete', ({ e, node }) => {
      e.stopPropagation()
      graph.freeze()
      const { preEdge, nextEdge, preNode, nextNode } = getPreAndNextNodeEdge(node.id)
      if (preEdge) {
        graph.removeEdge(preEdge.id)
      }
      if (nextEdge) {
        graph.removeEdge(nextEdge.id)
      }
      if (preEdge && nextEdge) {
        graph.addCell([createEdge(preNode, nextNode)])
      }
      graph.removeNode(node.id)

      layout()
    })
  }

  function updateEdges() {
    edges = nodes.reduce((arr, node, index) => {
      if (index === 0) {
        return []
      }
      arr.push(createEdge(nodes[index - 1], node))
      return arr
    }, [])
    console.log('edges', edges)
  }

  function getPreAndNextNodeEdge(id: string) {
    let preEdge, nextEdge, preNode, nextNode
    const edges = graph.getEdges()
    edges.forEach(edge => {
      const _preId = edge.store.previous.source.cell
      const _nextId = edge.store.previous.target.cell

      if (_preId === id) {
        nextEdge = edge
        nextNode = graph.getCell(_nextId)
      }
      if (_nextId === id) {
        preEdge = edge
        preNode = graph.getCell(_preId)
      }
    })

    return { preEdge, nextEdge, preNode, nextNode }
  }

  // 自动布局
  function layout() {
    const nodes = graph.getNodes()
    const edges = graph.getEdges()
    const g = new dagre.graphlib.Graph()
    g.setGraph({ nodesep: 16, ranksep: 16 })
    g.setDefaultEdgeLabel(() => ({}))

    const width = 260
    const height = 90
    nodes.forEach(node => {
      g.setNode(node.id, { width, height })
    })

    edges.forEach(edge => {
      const source = edge.getSource()
      const target = edge.getTarget()
      g.setEdge(source.cell, target.cell)
    })

    dagre.layout(g)

    graph.freeze()

    g.nodes().forEach(id => {
      const node = graph.getCell(id) as Node
      if (node) {
        const pos = g.node(id)
        node.position(pos.x, pos.y)
      }
    })

    edges.forEach(edge => {
      const source = edge.getSourceNode()!
      const target = edge.getTargetNode()!
      const sourceBBox = source.getBBox()
      const targetBBox = target.getBBox()

      console.log(sourceBBox, targetBBox)

      if (sourceBBox.x !== targetBBox.x) {
        const gap = targetBBox.y - sourceBBox.y - sourceBBox.height
        const fix = sourceBBox.height
        const y = sourceBBox.y + fix + gap / 2
        edge.setVertices([
          { x: sourceBBox.center.x, y },
          { x: targetBBox.center.x, y },
        ])
      } else {
        edge.setVertices([])
      }
    })

    graph.unfreeze()
  }

  function createNode(rank: string, name: string, image: string) {
    return graph.createNode({
      shape: 'org-node',
      attrs: {
        '.image': { xlinkHref: image },
        '.rank': {
          text: Dom.breakText(rank, { width: 160, height: 45 }),
        },
        '.name': {
          text: Dom.breakText(name, { width: 160, height: 45 }),
        },
      },
    })
  }

  function createEdge(source: Cell, target: Cell) {
    return graph.createEdge({
      shape: 'org-edge',
      source: { cell: source.id },
      target: { cell: target.id },
    })
  }

  onMounted(() => {
    // 定义样式
    // 我们用 insert-css 演示引入自定义样式
    // 推荐将样式添加到自己的样式文件中
    // 若拷贝官方代码,别忘了 npm install insert-css
    insertCss(`    .x6-cell {
        cursor: default;
      }
      .x6-node .btn {
        cursor: pointer;
      }
   `)

    // 创建画布
    graph = new Graph({
      container: document.getElementById('container')!,
      scroller: true,
      interacting: false,
      width: 800,
      height: 600,
    })

    nodes = [
      createNode('董事长', '审批', male),
      createNode(' CEO', '呵呵', female),
      createNode('小李', '描述', male),
    ]

    updateEdges()
    graph.resetCells([...nodes, ...edges])
    layout()
    graph.zoomTo(0.8)
    graph.centerContent()
    setup()
  })

  onUnmounted(() => {
    graph.dispose()
  })
</script>

<style scoped></style>